Averages and Measures of Spread
1. Types of Averages (Central Tendency)
Averages provide a single value that represents a data set.
Mean
The sum of all values divided by the total number of values.
- Non-grouped data: $\text{Mean} = \frac{\sum x}{n}$.
- Frequency data: $\text{Mean} = \frac{\sum (f \cdot x)}{\sum f}$ (where $f$ is frequency and $x$ is the value/midpoint).
Median
The middle value when data is ordered from least to greatest.
- Odd number of values: The exact middle term.
- Even number of values: The average of the two middle terms.
Mode
The value that appears most frequently.
- A data set can be unimodal (one mode), bimodal (two modes), or have no mode.
2. Measures of Spread
Describes how dispersed the data is around the average.
Range
The difference between the maximum and minimum values. $$\text{Range} = \text{Maximum} - \text{Minimum}$$
Interquartile Range (IQR)
The range of the middle 50% of the data. $$\text{IQR} = Q_3 - Q_1$$
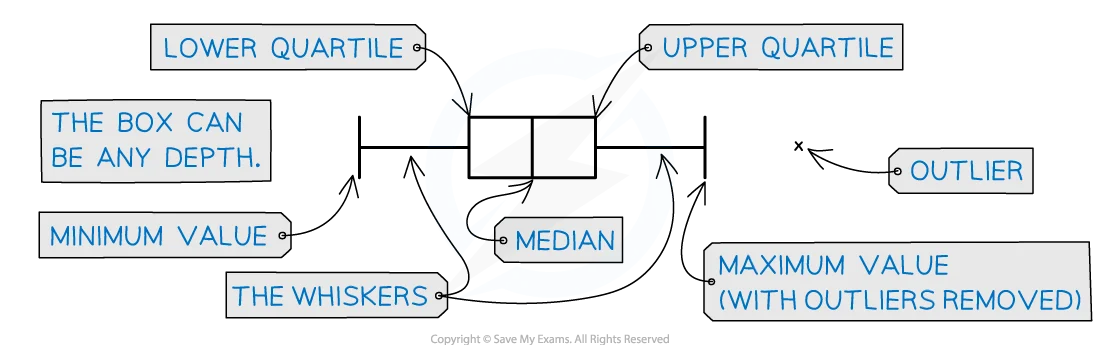
3. Quartiles
Values that divide the ordered data into four equal parts.
- Lower Quartile ($Q_1$): The median of the lower half of the data (25th percentile).
- Upper Quartile ($Q_3$): The median of the upper half of the data (75th percentile).
4. Grouped Data (Extended)
When data is given in classes (e.g., $0 < x \le 10$), we use estimates.
Estimated Mean
Since exact values are unknown, use the midpoint of each class.
- Find midpoint $m$ for each class.
- Calculate $\sum (f \cdot m)$.
- Divide by total frequency $\sum f$.
Modal Class
The class interval with the highest frequency.