Collection, Organising, and Displaying Data
1. Collection and Classifying Data
Data can be categorized into two main types:
- Qualitative (Categorical): Non-numerical data.
- Nominal: Categories with no inherent order (e.g., eye color, country).
- Ordinal: Categories with a logical order (e.g., satisfaction rating: low, medium, high).
- Quantitative (Numerical): Numerical data.
- Discrete: Values that can only take specific values, often counts (e.g., number of students in a class).
- Continuous: Values that can take any value within a range, often measurements (e.g., height, weight, time).
2. Organising Data
Before displaying data, it must be organized to make analysis easier.
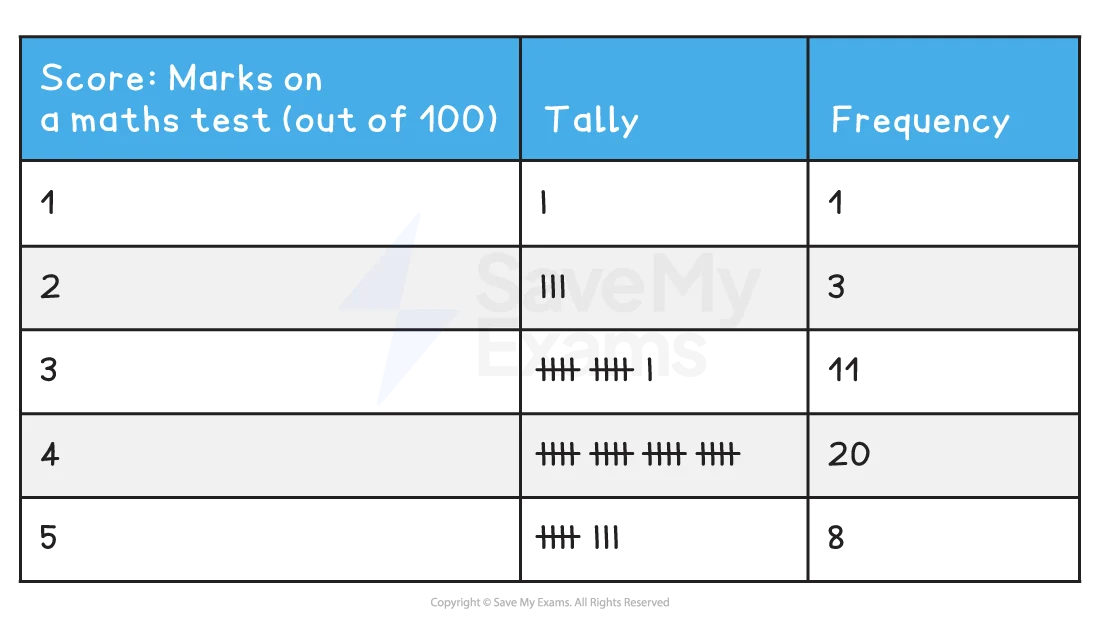
- Tally Charts: A quick way of recording frequency during data collection using marks ($\text{IIII} \text{I}$).
- Frequency Tables: A table showing the value (or group of values) and how often they occur.
- Two-Way Tables: Used to organize data that falls into two different categories (e.g., gender and preference).
3. Displaying Data (Charts)
Different charts are used depending on the type of data and the goal of the presentation.
Bar Charts
- Used for discrete or categorical data.
- Bars are separated by gaps.
- Composite/Dual Bar Charts: Used to compare two sets of data side-by-side.
Pie Charts
- Used to show proportions of a whole.
- The total of all sectors is $360^\circ$.
- Calculating Sector Angle: $\text{Angle} = \frac{\text{Frequency}}{\text{Total Frequency}} \times 360^\circ$.
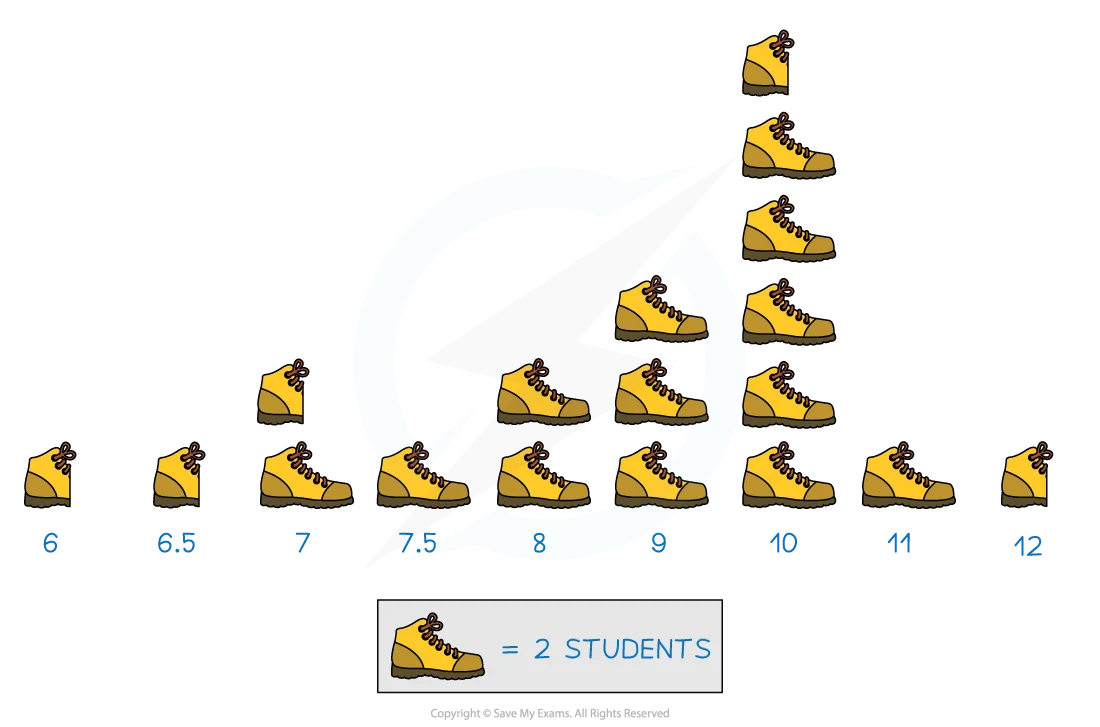
Pictograms
- Use symbols or images to represent a specific quantity of data.
- A Key must always be provided to explain what each symbol represents.
Stem-and-Leaf Diagrams
- Used for numerical data.
- Splits each data point into a ‘stem’ (leading digit) and a ’leaf’ (last digit).
- Key Feature: Data is kept in its original form, allowing for easy identification of the median and mode.
- A Key is required (e.g., $2|1$ means 21).

4. Comparison and Inference
Averages (Measures of Central Tendency)
Averages summarize the “center” of a data set:
- Mean: The sum of all values divided by the total number of values. $$\text{Mean} = \frac{\sum x}{n}$$
- Median: The middle value when data is arranged in ascending order.
- If $n$ is odd: Middle value.
- If $n$ is even: Average of the two middle values.
- Mode: The value that occurs most frequently in the data set.
Spread and Inference
- Spread: Use the range ($\text{Max} - \text{Min}$) to describe how spread out the data is.
- Inferences: Making general conclusions about a population based on a sample of data.