Introduction to Probability
1. Basic Probability
Probability Scale
Probability is measured on a scale from $0$ to $1$:
- $0$: Impossible event.
- $1$: Certain event.
- $0.5$: Equally likely as not.
Fundamental Rules
- Complementary Events: The probability of an event NOT happening is $P(\text{not } A) = 1 - P(A)$.
- Relative Frequency: An estimate of probability based on experimental data. $$\text{Relative Frequency} = \frac{\text{Number of successful trials}}{\text{Total number of trials}}$$
- Expected Frequency: The number of times an event is expected to occur over a number of trials. $$\text{Expected Frequency} = P(A) \times \text{Total Trials}$$
2. Sample Space
A Sample Space is a list of all possible outcomes of an experiment.
- Sample Space Diagrams: Tables used to list outcomes for two events (e.g., rolling two dice).
- Calculation: $P(A) = \frac{\text{Number of outcomes satisfying } A}{\text{Total outcomes in sample space}}$.
Example: Sample space of rolling 2 dice

3. Combined Events
Event Types
- Independent Events: The outcome of one event does not affect the outcome of another.
- Mutually Exclusive Events: Events that cannot happen at the same time.
Tools for Calculation
- Venn Diagrams (2 Sets): Used to represent the relationship between two events.
- Intersection ($\cap$): Both events occur.
- Union ($\cup$): Either or both events occur.

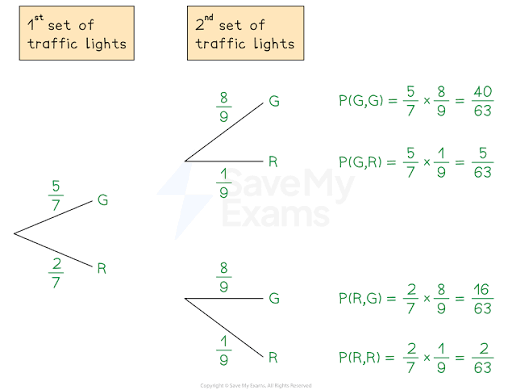
- Tree Diagrams (With Replacement):
- Each branch represents an outcome.
- Multiply probabilities along the paths to find the probability of a combined sequence of events.
- Sum the probabilities of the different paths that satisfy the required outcome.