1. Quadratic graphs
A quadratic graph has form
$$y=ax^2+bx+c, \qquad a\neq0.$$
- If $a>0$, parabola opens upward and has a minimum.
- If $a<0$, parabola opens downward and has a maximum.
- $y$-intercept is $(0,c)$.
- Roots, or $x$-intercepts, are solutions of $ax^2+bx+c=0$.
- Axis of symmetry is
$$x=-\frac{b}{2a}.$$
Find turning-point $y$-coordinate by substituting this $x$-value into the equation.
Worked example: For $y=x^2+4x+3$, $a=1$, $b=4$, and $c=3$.
$$x=-\frac{4}{2(1)}=-2$$
$$y=(-2)^2+4(-2)+3=-1$$
Turning point is $(-2,-1)$ and the graph opens upward. Its roots are found from
$$x^2+4x+3=(x+1)(x+3)=0,$$
so the $x$-intercepts are $(-1,0)$ and $(-3,0)$.
Sketching a quadratic
- Check sign of $a$.
- Find $y$-intercept by setting $x=0$.
- Find roots by setting $y=0$, if real roots exist.
- Find axis and turning point.
- Plot points on both sides of the axis at equal horizontal distances.
- Draw a smooth, symmetric parabola with a sensible scale.
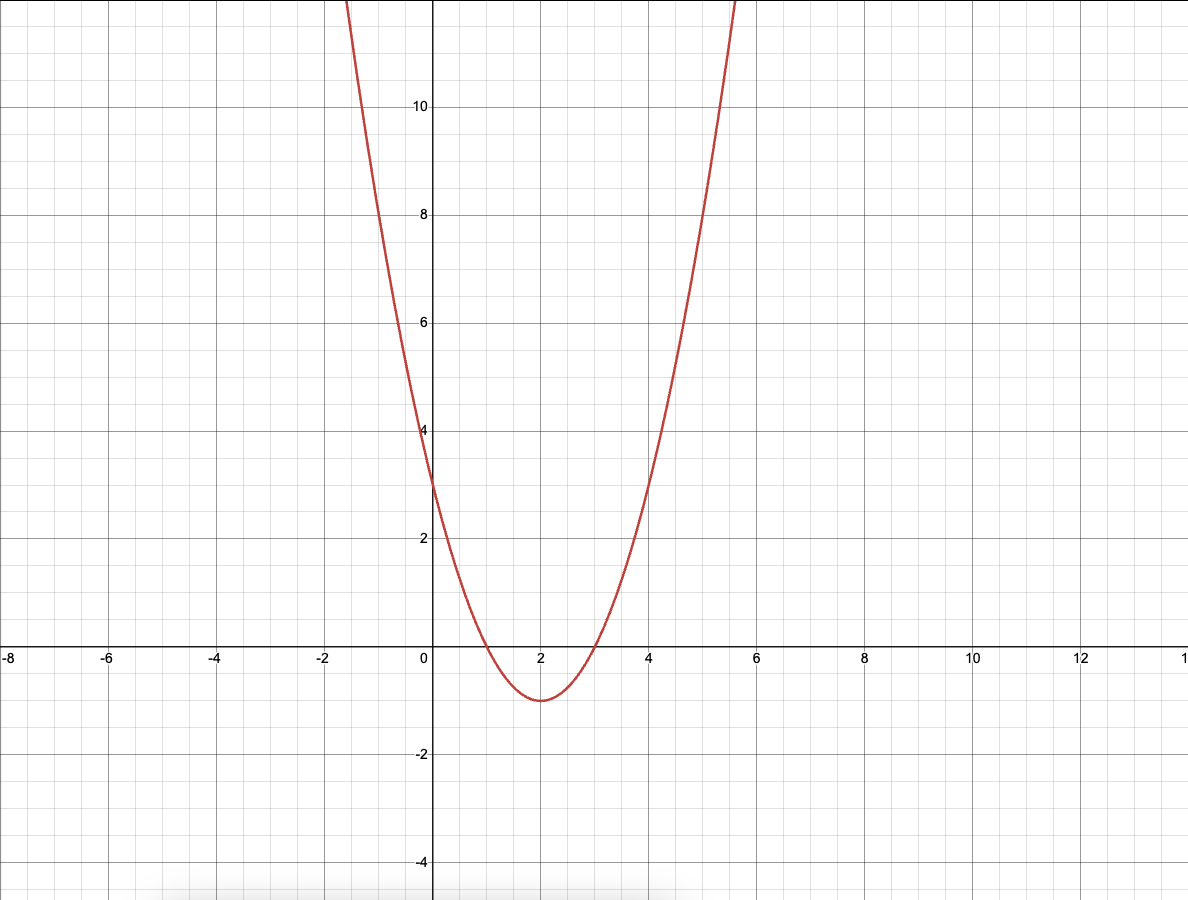
For $y=x^2-4x+3$, the axis is $x=2$, roots are $x=1$ and $x=3$, and turning point is $(2,-1)$. Points $(0,3)$ and $(4,3)$ confirm symmetry.
Completing the square
Completing the square gives turning-point form: $$y=a(x+h)^2+k,$$
where turning point is $(-h,k)$. For example,
$$ \begin{aligned} y&=2x^2+8x+5\\ \\ &=2(x^2+4x)+5\\ \\ &=2(x+2)^2-3. \end{aligned} $$
The turning point is $(-2,-3)$ and the graph has a minimum because $a=2>0$.
Steps:
- Make the $x^2$ coefficient 1 by dividing the whole equation by the number in front of $x^2$
- Finding the nearest square as $\left( x + \frac{b}{2} \right)^2$
- Calculate the “extra” or “missing” $c$ value
- Substitute square into the original equation
- Expand until equation matches to form
Full explanation found here: Chapter 14
2. Reciprocal and other power graphs
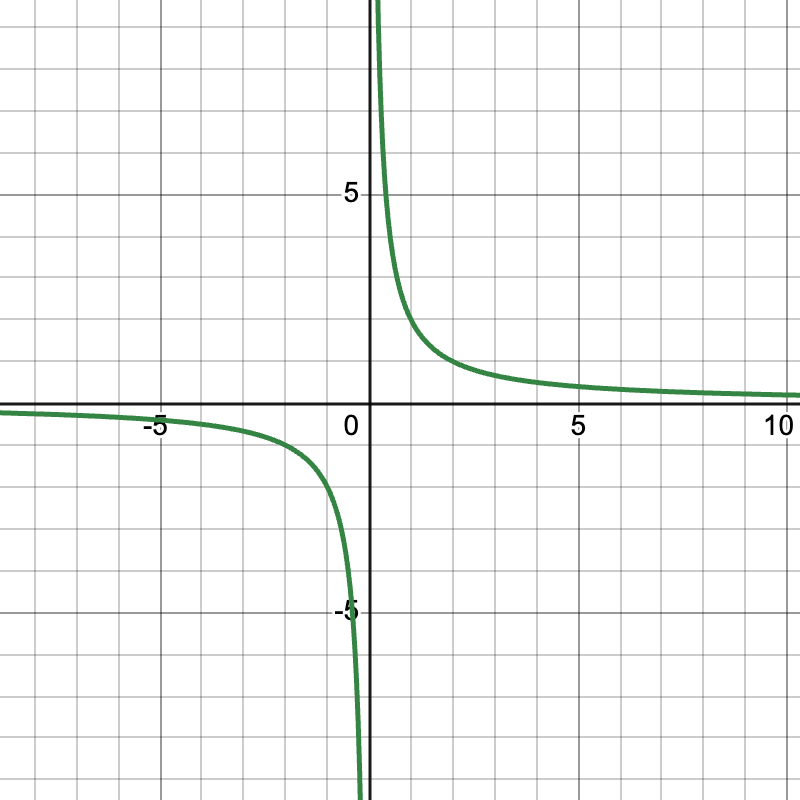
A reciprocal graph has form
$$y=\frac{a}{x}+b, \qquad a\neq0.$$
Its domain excludes $x=0$.
- Vertical asymptote: $x=0$.
- Horizontal asymptote: $y=b$.
- If $a>0$, branches lie in the upper-right and lower-left relative to the asymptote centre.
- If $a<0$, branches lie in the upper-left and lower-right.
An asymptote is a straight line that the graph gets closer and closer to, but does not reach. For this graph, the vertical asymptote is $x=0$ and the horizontal asymptote is $y=b$.
For $y=\frac{2}{x}$, the asymptotes are $x=0$ and $y=0$. The graph lies in quadrants I and III. For $y=-\frac{3}{x}$, it lies in quadrants II and IV.
Power Graphs
- $y=\frac{a}{x^2}$: domain $x\neq0$; both branches are above the $x$-axis when $a>0$ and below when $a<0$.
- $y=\frac{a}{\sqrt{x}}$: domain $x>0$; use only the right-hand branch.
- $y=a$: horizontal line.
- $y=ax$: straight line through the origin.
- $y=ax^2$: parabola.
- $y=ax^3$: cubic.
Use a table of values and label asymptotes. Never substitute an excluded value into a reciprocal expression.
3. Graphical solutions and simultaneous equations
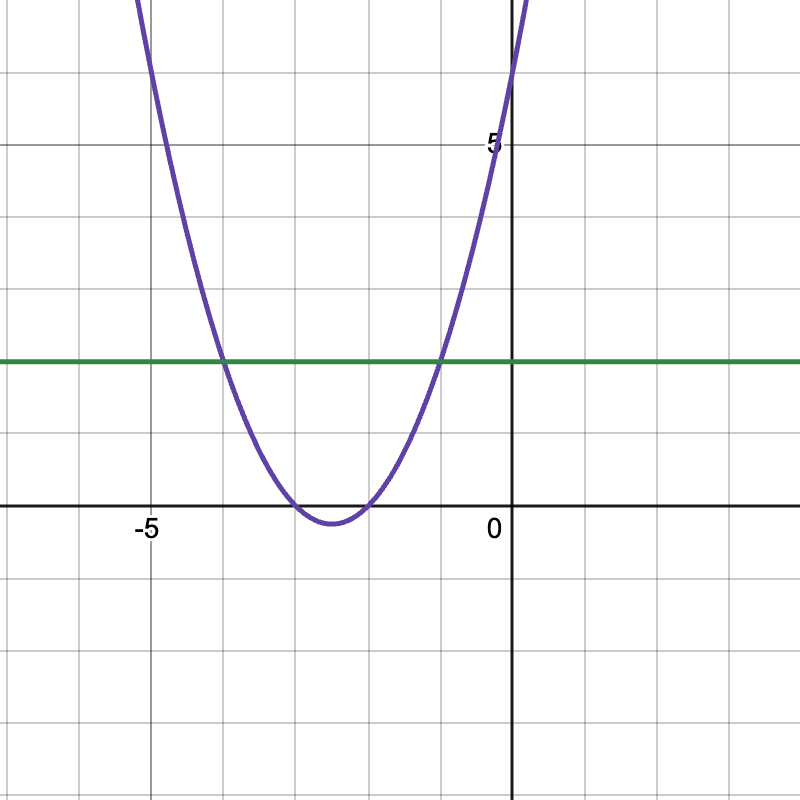
To solve $f(x)=0$ graphically, plot $y=f(x)$ and read the $x$-intercepts. These give approximate solutions, so include an appropriate degree of accuracy.
To solve two simultaneous equations graphically, plot both graphs. Their intersection coordinates are the simultaneous solutions.
Example:
$$ \begin{cases} y=x^2-3x+2\\ \\ y=-x+4 \end{cases} $$
Set the right sides equal:
$$x^2-3x+2=-x+4,$$
so
$$x^2-2x-2=0.$$
Therefore
$$x=1\pm\sqrt{3}.$$
Substitute each $x$-value into $y=-x+4$. The solutions are
$$(1+\sqrt{3},3-\sqrt{3})$$
and
$$(1-\sqrt{3},3+\sqrt{3}).$$
4. Cubic graphs
A cubic has form
$$y=ax^3+bx^2+cx+d.$$
- If $a>0$, the left end falls and the right end rises.
- If $a<0$, the left end rises and the right end falls.
- A cubic has at most three real roots.
- It may have two turning points, no turning points, or one stationary inflection point.
Finding roots step by step
To find roots, set $y=0$ and solve for $x$.
Use:
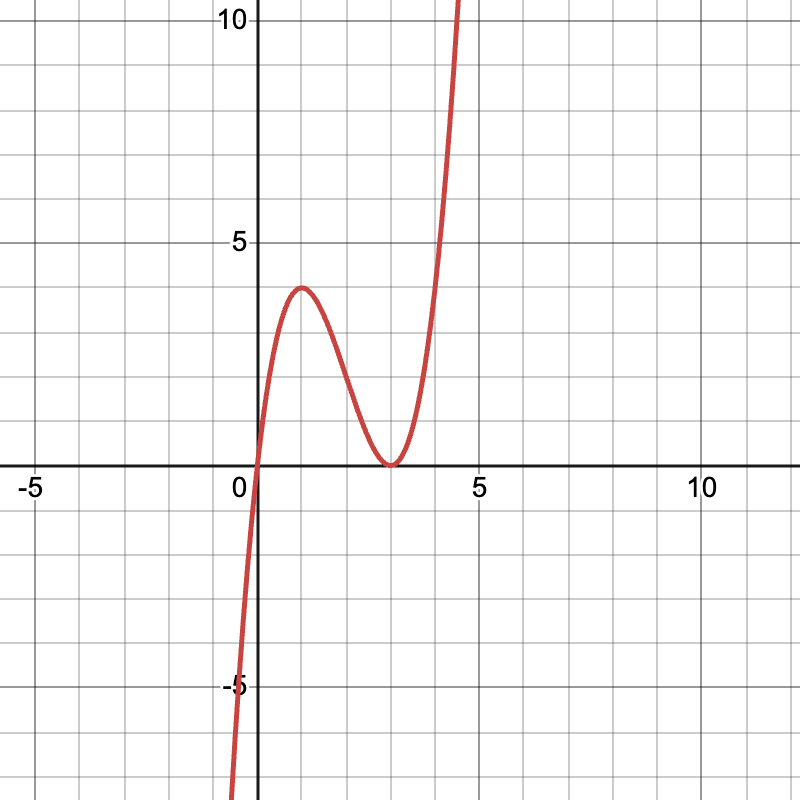
$$y=x^3-6x^2+9x$$
-
Set the function equal to zero:
$$x^3-6x^2+9x=0$$
-
Take out the common factor $x$:
$$x(x^2-6x+9)=0$$
-
Recognise the perfect square:
$$x^2-6x+9=(x-3)^2$$
Therefore:
$$x(x-3)^2=0$$
-
Set each factor equal to zero:
$$x=0$$
or
$$(x-3)^2=0$$
-
Solve the second factor:
$$x-3=0 \quad\Rightarrow\quad x=3$$
Therefore, the roots are $x=0$ and $x=3$. The root $x=3$ is repeated because $(x-3)$ appears twice. The curve touches the $x$-axis at $(3,0)$ instead of crossing it. The other root is $(0,0)$.
so roots are $x=0$ and $x=3$. The root $x=3$ is repeated, so the curve touches the $x$-axis there rather than crossing it.
Finding the stationary points
Use the same cubic:
$$y=x^3-6x^2+9x$$
-
Differentiate the function:
$$\frac{dy}{dx}=3x^2-12x+9$$
-
Factorise the derivative:
$$\frac{dy}{dx}=3(x-1)(x-3)$$
-
Set the derivative equal to zero. A stationary point has zero gradient:
$$3(x-1)(x-3)=0$$
-
Solve each factor:
$$x-1=0 \quad\Rightarrow\quad x=1$$
$$x-3=0 \quad\Rightarrow\quad x=3$$
-
Substitute each $x$-value into the original cubic.
For $x=1$:
$$y=1^3-6(1)^2+9(1)=1-6+9=4$$
For $x=3$:
$$y=3^3-6(3)^2+9(3)=27-54+27=0$$
-
Write the stationary points:
$$(1,4)\quad\text{and}\quad(3,0)$$
-
Classify them by checking the gradient on either side. The gradient changes from positive to negative at $x=1$, so $(1,4)$ is a local maximum. It changes from negative to positive at $x=3$, so $(3,0)$ is a local minimum.
5. Exponential graphs
An exponential graph has form
$$y=ab^x+c,$$
where $a\neq0$, $b>0$, and $b\neq1$.
- $b>1$: growth.
- $0<b<1$: decay.
- Horizontal asymptote is $y=c$.
- $y$-intercept is found by setting $x=0$.
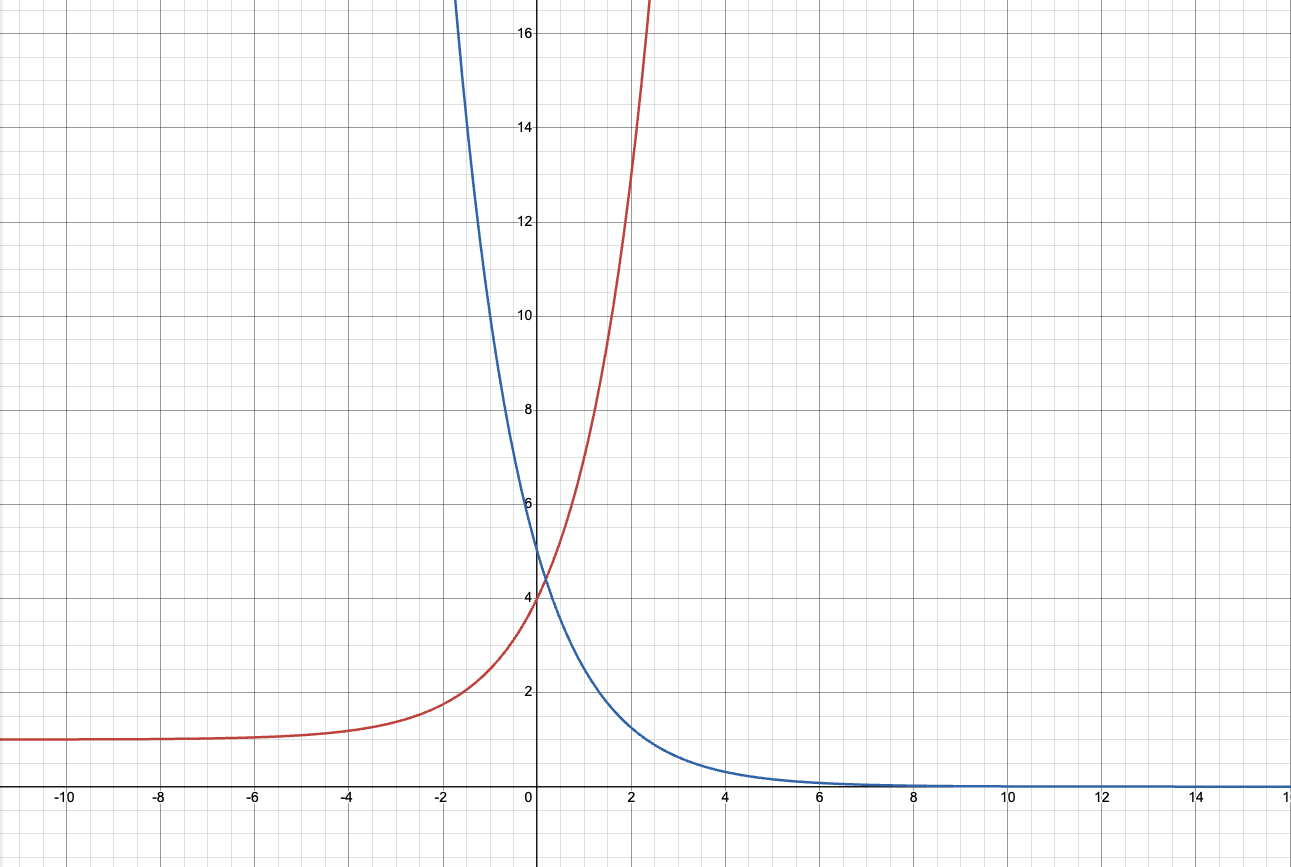
For $y=3\cdot2^x+1$, the graph has asymptote $y=1$, passes through $(0,4)$, approaches $y=1$ as $x\to-\infty$, and increases without bound as $x\to+\infty$.
For $y=5\cdot0.5^x$, each increase of $1$ in $x$ halves $y$. This is a half-life statement when $x$ measures time.
6. Gradients, derivatives, and stationary points
Drawing a Tangent
A tangent to a curve at a point is a straight line that just touches the curve at that point without crossing it (locally).
To draw a tangent at point $P$:
- Draw a small segment of the curve near $P$.
- Draw the tangent line that best fits this segment.
- The gradient of the tangent approximates the instantaneous rate of change at $P$.

Calculating the gradient of a tangent
The gradient of a line through $(x_1,y_1)$ and $(x_2,y_2)$ is
$$\frac{y_2-y_1}{x_2-x_1}.$$
Using two points close together gives an estimate of the tangent gradient. A derivative gives the exact gradient:
$$\frac{dy}{dx}=f’(x).$$
For $y=ax^n$:
$$\frac{dy}{dx}=anx^{n-1}.$$
Derivatives of sums are found term by term. For example,
$$\frac{d}{dx}(3x^4+2x^3-5x+7)=12x^3+6x^2-5.$$
A stationary point satisfies
$$\frac{dy}{dx}=0.$$
It is a maximum if the gradient changes from positive to negative, and a minimum if the gradient changes from negative to positive. No sign change means stationary inflection rather than a turning point.
For practical graphs, gradient represents rate of change. For example, gradient of a distance-time graph represents speed; gradient of a speed-time graph represents acceleration.
Exam checklist
- Label axes, units, scale, roots, intercepts, turning points, and asymptotes.
- State whether a graphical answer is approximate.
- Check domain restrictions before plotting or solving.
- For a stationary point, verify the sign change before calling it a maximum or minimum.
- For an exponential graph, check which direction approaches the horizontal asymptote.